1. Passage Reading
2. Verbal Logic
3. Non Verbal Logic
4. Numerical Logic
5. Data Interpretation
6. Reasoning
7. Analytical Ability
8. Quantitative Aptitude
(a) 35,500
| |
(b) 27,000
| |
(c) 22,500
| |
(d) 17,500
|
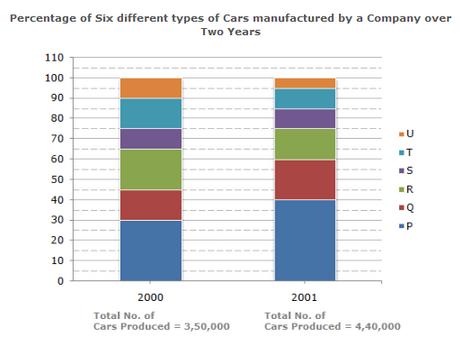
436. Total number of cars of models P, Q and T manufactured in 2000 is?
(a) 2,45,000
| |
(b) 2,27,500
| |
(c) 2,10,000
| |
(d) 1,92,500
|
437. If the percentage production of P type cars in 2001 was the same as that in 2000, then the number of P type cars produced in 2001 would have been?
(a) 1,40,000
| |
(b) 1,32,000
| |
(c) 1,17,000
| |
(d) 1,05,000
|
438. If 85% of the S type cars produced in each year were sold by the company, how many S type cars remain unsold?
(a) 7650
| |
(b) 9350
| |
(c) 11,850
| |
(d) 12,250
|
439. For which model the percentage rise/fall in production from 2000 to 2001 was minimum?
(a) Q
| |
(b) R
| |
(c) S
| |
(d) T
|
TOTAL
Detailed Solution| 1 | 2 | 3 | 4 | 5 | 6 | 7 | 8 | 9 | 10 | 11 | 12 | 13 | 14 | 15 | 16 | 17 | 18 | 19 | 20 |
| 21 | 22 | 23 | 24 | 25 | 26 | 27 | 28 | 29 | 30 | 31 | 32 | 33 | 34 | 35 | 36 | 37 | 38 | 39 | 40 |
| 41 | 42 | 43 | 44 | 45 | 46 | 47 | 48 | 49 | 50 | 51 | 52 | 53 | 54 | 55 | 56 | 57 | 58 | 59 | 60 |
| 61 | 62 | 63 | 64 | 65 | 66 | 67 | 68 | 69 | 70 | 71 | 72 | 73 | 74 | 75 | 76 | 77 | 78 | 79 | 80 |
| 81 | 82 | 83 | 84 | 85 | 86 | 87 | 88 | 89 | 90 | 91 | 92 | 93 | 94 | 95 | 96 | 97 | 98 | 99 | 100 |
| 101 | 102 | 103 | 104 | 105 | 106 | 107 | 108 | 109 | 110 | 111 | 112 | 113 | 114 | 115 | 116 | 117 | 118 | 119 | 120 |
| 121 | 122 | 123 | 124 | 125 | 126 | 127 | 128 | 129 | 130 | 131 | 132 | 133 | 134 | 135 | 136 | 137 | 138 | 139 | 140 |
| 141 | 142 | 143 | 144 | 145 | 146 | 147 | 148 | 149 | 150 | 151 | 152 | 153 | 154 | 155 |
 Passage Reading
Verbal Logic
Non Verbal Logic
Numerical Logic
Data Interpretation
Reasoning
Analytical Ability
Basic Numeracy
About Us
Contact
Privacy Policy
Major Tests
FAQ
Passage Reading
Verbal Logic
Non Verbal Logic
Numerical Logic
Data Interpretation
Reasoning
Analytical Ability
Basic Numeracy
About Us
Contact
Privacy Policy
Major Tests
FAQ